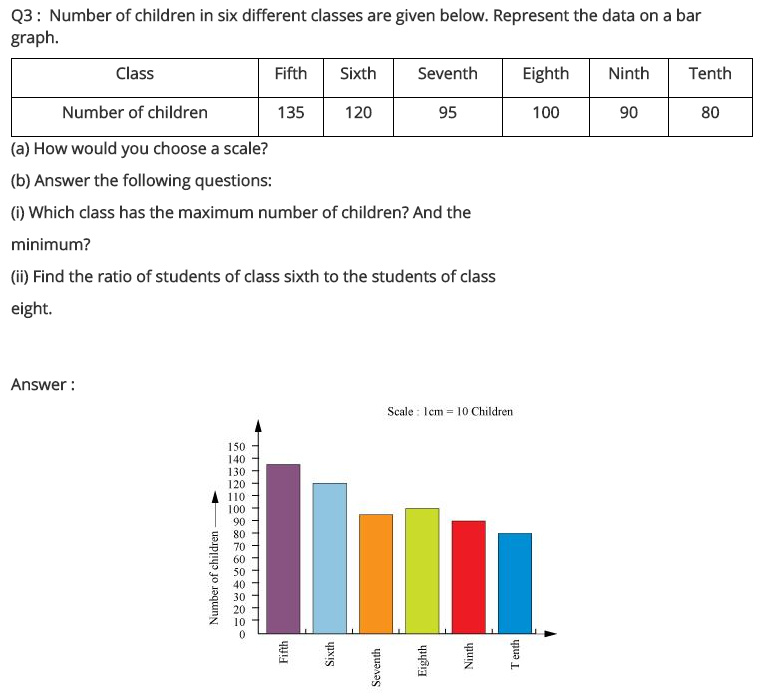
.png)
Class 7 Maths Chapter 3 Data Handling NCERT Solutions
- Class 7 Maths Data Handling Exercise 3.1
- Class 7 Maths Data Handling Exercise 3.2
- Class 7 Maths Data Handling Exercise 3.3
- Class 7 Maths Data Handling Exercise 3.4
NCERT Solutions for Class 7 Maths Chapter 3 Data Handling Exercise 3.1
Ex 3.1 Class 7 Maths Question 1.
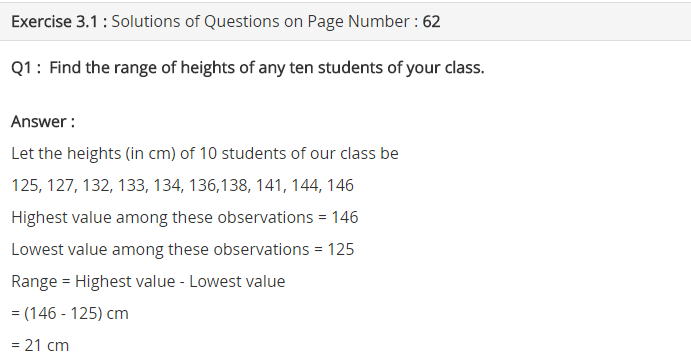
Find the range of heights of any ten students of your class.
Solution:
Let us have the heights of 10 students are as follows:
140 cm, 141.5 cm, 138 cm, 150 cm, 161 cm,
138 cm, 140.5 cm, 135.5 cm, 160 cm, 158 cm
Here, minimum height = 135.5 cm
Maximum height =161 cm
∴ Range = Maximum height – Minimum height
= 161 cm — 135.5 cm = 25.5 cm
Hence, the required range = 25.5 cm.
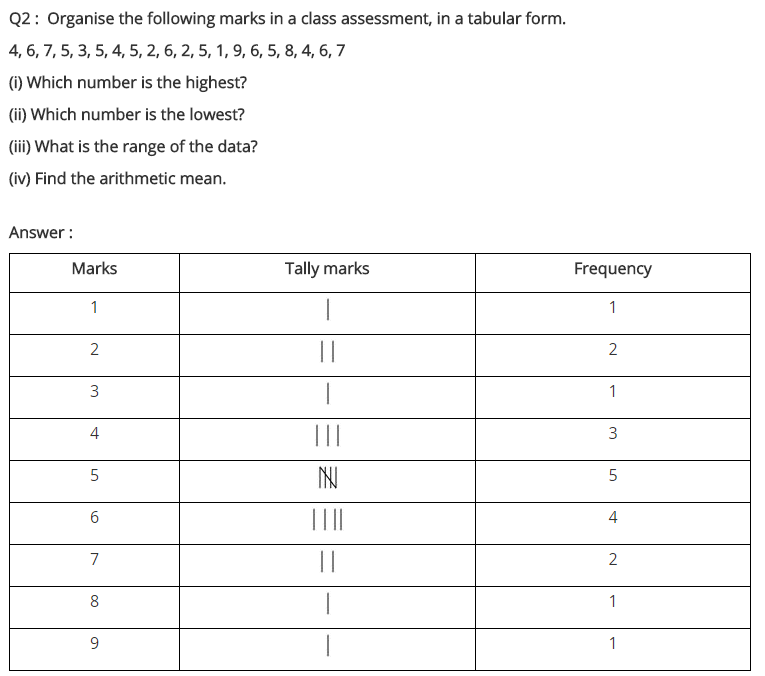
Ex 3.1 Class 7 Maths Question 2.
Organise the following marks in a class assessment in a tabular form.
4, 6, 7, 5, 3, 5, 4, 5, 2, 6, 2, 5, 1, 9, 6, 5, 8, 4, 6, 7
(i) Which number is the highest?
(ii) Which number is the lowest?
(iii) What is the range of the data?
(iv) Find the arithmetic mean.
Solution:
Let us form a frequency distribution table: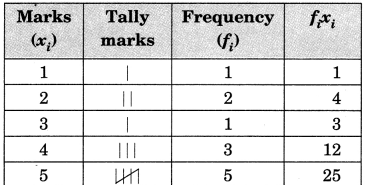
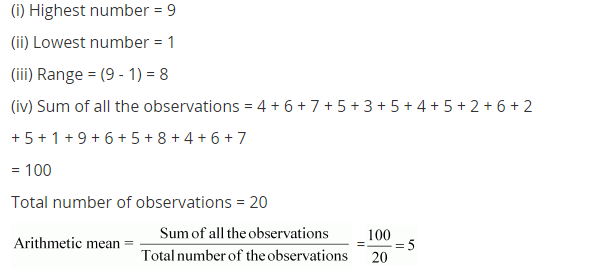
(i) 9 is the highest marks.
(ii) 1 is the lowest marks.
(iii) Range = Max. marks – Min. marks
= 9 – 1 = 8
(iv) Arithmetic mean =
Ex 3.1 Class 7 Maths Question 3.
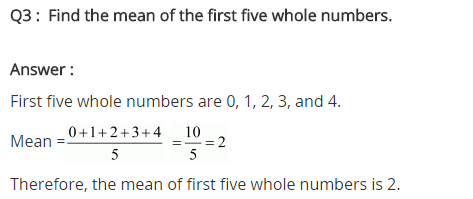
Find the mean of first five whole numbers.
Solution:
First 5 whole numbers are 0, 1, 2, 3, 4
∴ Mean
Hence, the required mean = 2.
Ex 3.1 Class 7 Maths Question 4.
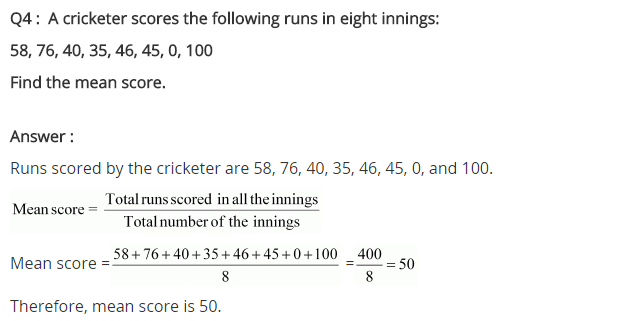
A cricketer scores the following runs in eight innings:
58, 76, 40, 35, 46, 45, 0, 100
Find the mean score.
Solution:
Following are the scores of the runs in eight innings:
58, 76, 40, 35, 46, 45, 0, 100
∴ Mean =
Hence, the required mean = 50.
Ex 3.1 Class 7 Maths Question 5.
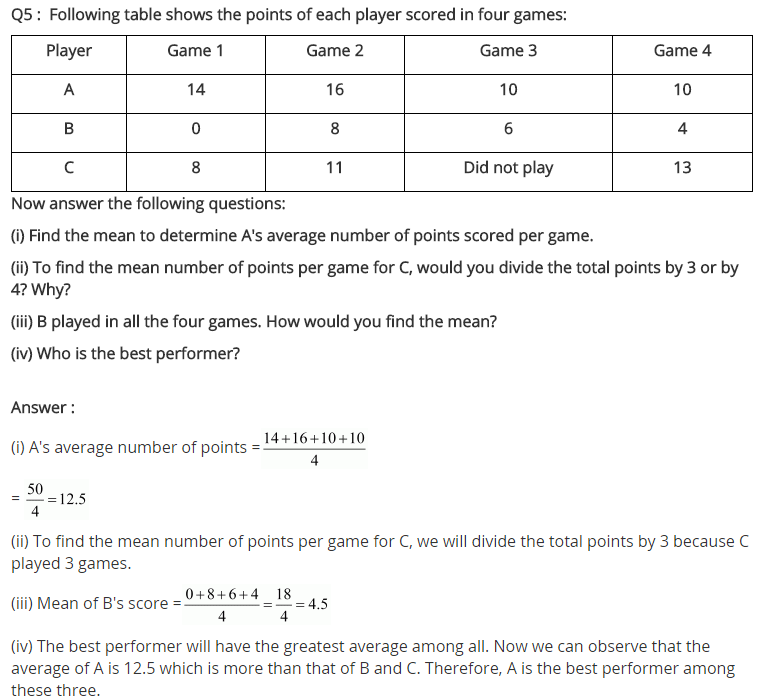
Following table shows the points of each player scored in four games:
| Player | Game 1 | Game 2 | Game 3 | Game 4 |
| A | 14 | 16 | 10 | 10 |
| B | 0 | 8 | 6 | 4 |
| C | 8 | 11 | Did not play | 13 |
Now answer the following questions:
(i) Find the mean to determine A’s average number of points scored per game.
(ii) To find the mean number of points per game for C, would you divide the total points by 3 or by 4? Why?
(iii) B played in all the four games. How would you find the mean?
(iv) Who is the best performer?
Solution:
(i) Number of points scored by A in all games are
Game 1 – 14, Game 2 = 16, Game 3 = 10, Game 4 = 10
∴ Average score =
(ii) Since, C did not play Game 3, he played only 3 games. So, the total will be divided by 3.
(iii) Number of points scored by B in all the games are Game 1 = 0, Game 2 = 8, Game 3 = 6, Game 4 = 4
∴ Average score =
(iv) Mean score of C
Mean score of C = 10.67
While mean score of A = 12.5
Clearly, A is the best performer.
Ex 3.1 Class 7 Maths Question 6.
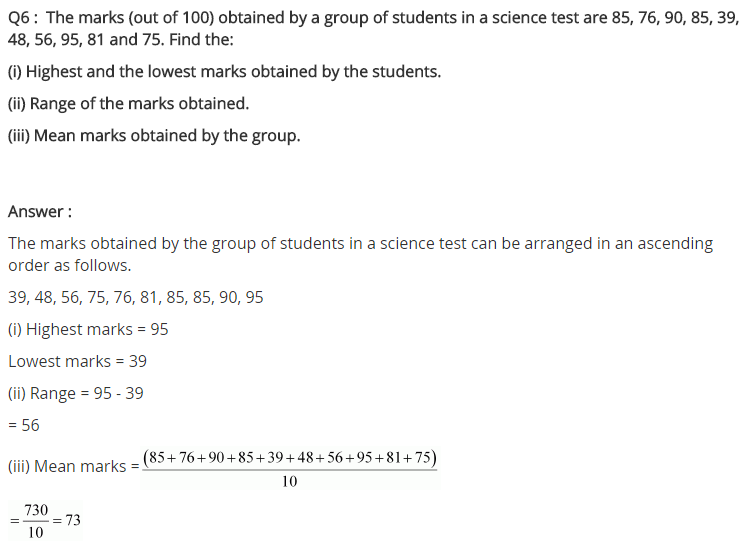
The marks (out of 100) obtained by a group of students in a science test are 85, 76, 90, 85, 39, 48, 56, 95, 81 and 75. Find the
(i) highest and the lowest marks obtained by the students.
(ii) range of the marks obtained.
(iii) mean marks obtained by the group.
Solution:
Marks obtained are:
85, 76, 90, 85, 39, 48, 56, 95, 81 and 75
(i) Highest marks = 95
Lowest marks = 39
(ii) Range of the marks
= Highest marks – Lowest marks
= 95 – 39 = 56
(iii) Mean marks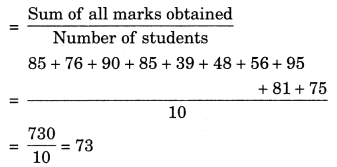
Ex 3.1 Class 7 Maths Question 7.
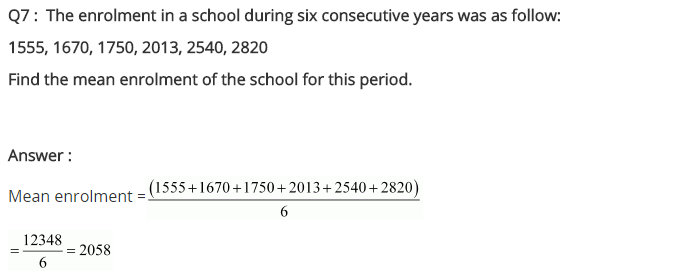
The enrolment in a school during six consecutive years was as follows:
1555, 1670, 1750, 2013, 2540, 2820
Find the mean enrolment of the school for this period.
Solution:
Mean enrolment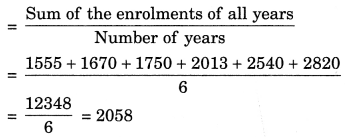
Thus, the required mean = 2058.
Ex 3.1 Class 7 Maths Question 8.
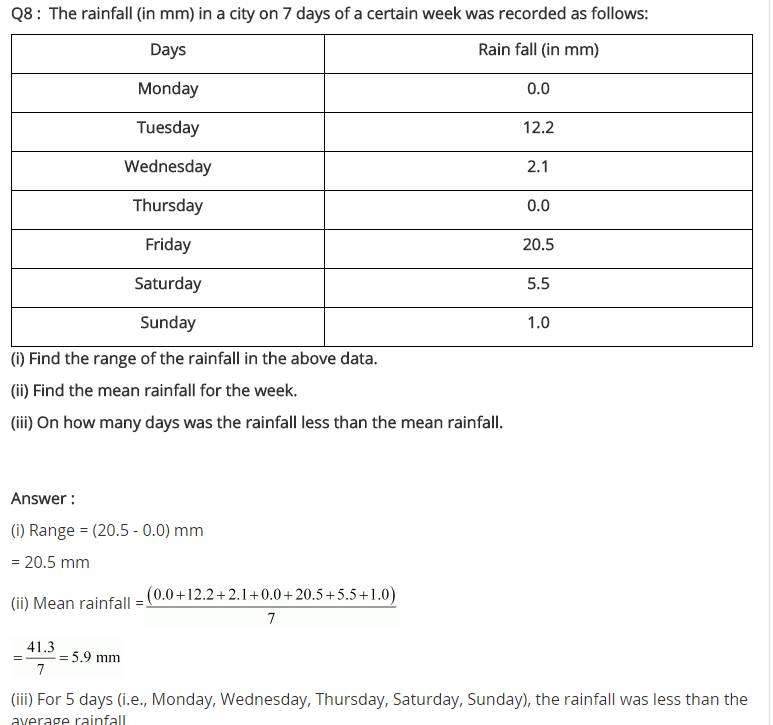
The rainfall (in mm) in a city on 7 days of a certain week was recorded as follows:
| Day | Rainfall (in mm) |
| Monday | 0.0 |
| Tuesday | 12.2 |
| Wednesday | 2.1 |
| Thursday | 0.0 |
| Friday | 20.5 |
| Saturday | 5.5 |
| Sunday | 1.0 |
(i) Find the range of the rainfall in the above data.
(ii) Find the mean rainfall for the week.
(iii) On how many days was the rainfall less than the mean rainfall?
Solution:
(i) Maximum rainfall = 20.5 mm
Minimum rainfall = 0.0 mm
∴ Range = Maximum rainfall – Minimum rainfall
= 20.5 mm – 0.0 mm = 20.5 mm
(ii) Mean rainfall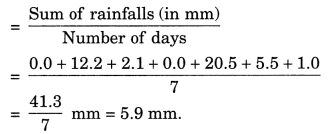
(iii) Number of days on which the rainfall was less than the mean rainfall = Monday, Wednesday, Thursday, Saturday, Sunday = 5 days.
Ex 3.1 Class 7 Maths Question 9.
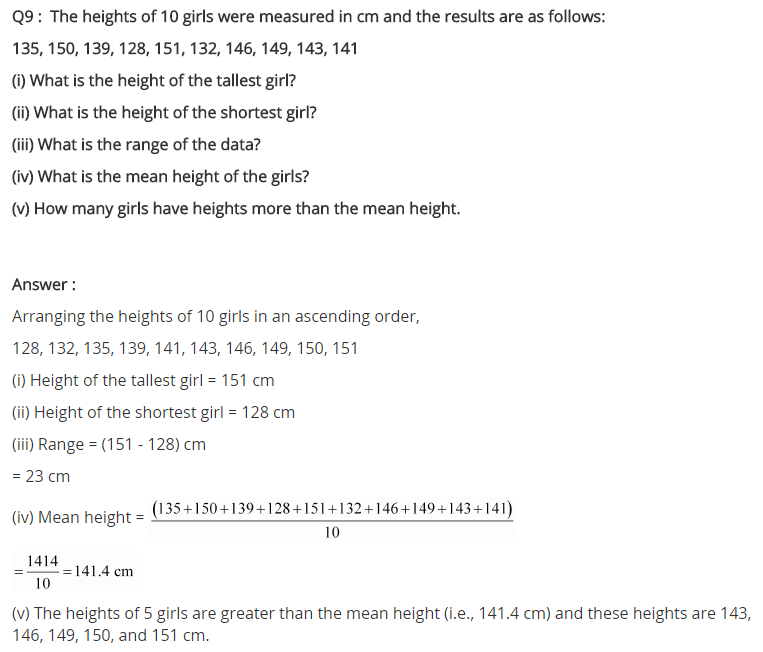
The heights of 10 girls were measured in cm and the results are as follows:
135, 150, 139, 128, 151, 132, 146, 149, 143, 141
(i) What is the height of the tallest girl?
(ii) What is the height of the shortest girl?
(Hi) What is the range of the data?
(iv) What is the mean height of the girls?
(v) How many girls have heights more than the mean height?
Solution:
(i) Height of the tallest girl = 151 cm.
(ii) Height of the shortest girl = 128 cm.
(iii) Range = Height of tallest girl – Height of the shortest girl
= 151 cm – 128 cm = 23 cm.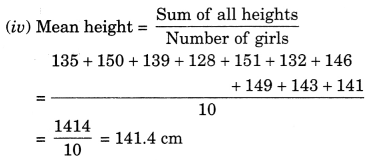
(v) Number of girls having more height than the mean height
= 150, 151, 146, 149 and 143 = 5 girls
NCERT Solutions for Class 7 Maths Chapter 3 Data Handling Exercise 3.2
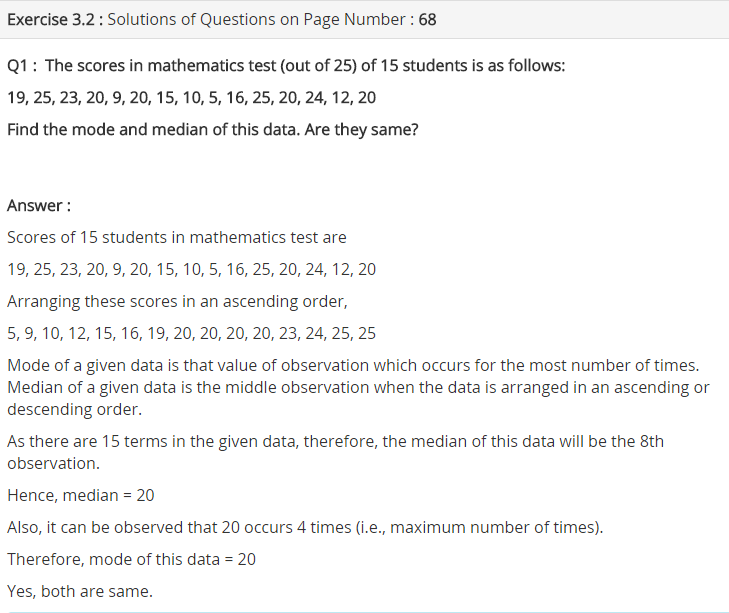
Ex 3.2 Class 7 Maths Question 1.
The scores in mathematics test (out of 25) of 15 students is as follows:
19, 25, 23, 20, 9, 20, 15, 10, 5, 16, 25, 20, 24, 12, 20
Find the mode and median of this data. Are they same?
Solution:
Given data:
19, 25, 23, 20, 9, 20, 15, 10, 5, 16, 25, 20, 24, 12, 20
Let us arrange the given data in increasing order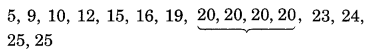
Since 20 occurs 4 times (highest)
∴ Mode = 20
n = 15 (odd)
∴ Median =
= 8th term = 20
Thus, median = 20 and mode = 20
∴ Mode and median are same.
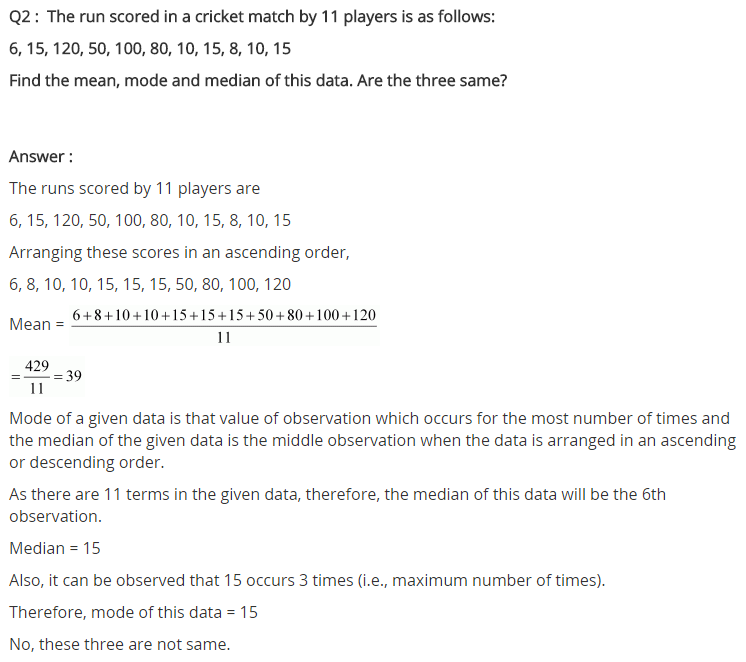
Ex 3.2 Class 7 Maths Question 2.
The runs scored in a cricket match by 11 players is as follows:
6, 15, 120, 50, 100, 80, 10, 15, 8, 10, 15
Find the mean, mode and median of this data. Are the three same?
Solution:
Given data:
6, 15, 120, 50, 100, 80, 10, 15, 8, 10, 15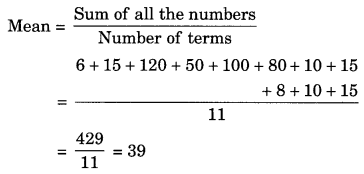
Arranging the given data in increasing order, we get![]()
Here, 15 occurs 3 times (highest)
∴ Mode = 15
n = 11 (odd)
∴ Median =
Thus mean = 39, mode = 15 and median = 15
No, they are not same.
Ex 3.2 Class 7 Maths Question 3.
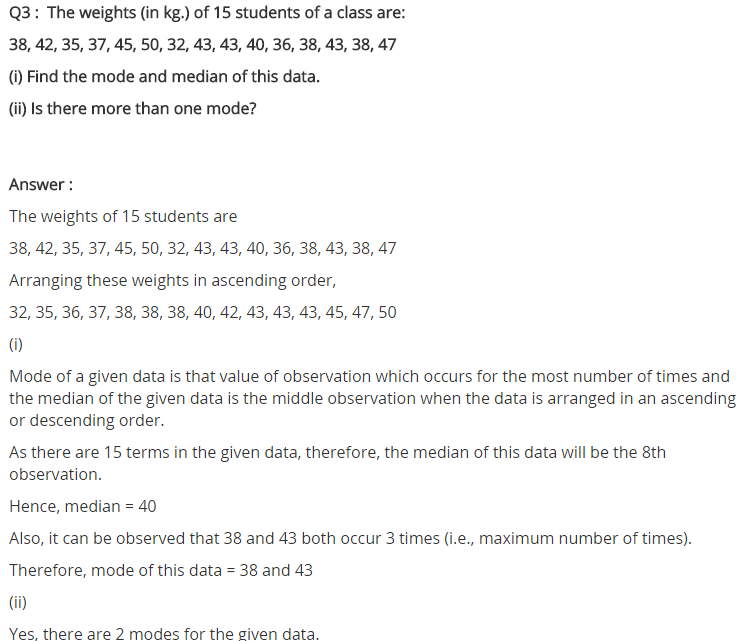
The weights (in kg) of 15 students of a class are:
38, 42, 35, 37, 45, 50, 32, 43, 43, 40, 36, 38, 43, 38, 47
(i) Find the mode and median of this data.
(ii) Is there more than one mode?
Solution:
Given data: 38, 42, 35, 37,45, 50, 32,43, 43,40, 36, 38, 43, 38, 47
Arranging in increasing order, we get![]()
(i) Here, 38 and 42 occur 3 times (highest)
Thus mode = 38 and 43
n = 15(odd)
Median =
= 8th term = 40
Thus mode 38 and 43 and median = 40
(ii) Yes, the given data has two modes i.e. 38 and 43.
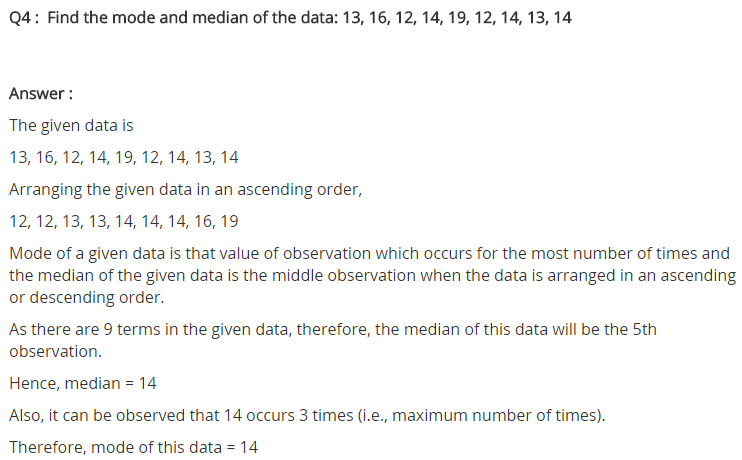
Ex 3.2 Class 7 Maths Question 4.
Find the mode and median of the data:
13, 16, 12, 14, 19, 12, 14, 13, 14
Solution:
Arranging the given data in increasing order, we get![]()
Here, 14 occur 3 times (highest)
Thus, mode = 14
n = 9(odd)
∴ Median =
= 5th term = 14
Hence, mode = 14 and median = 14.
Ex 3.2 Class 7 Maths Question 5.
Tell whether the statement is true or false.
(i) The mode is always one of the number in a data.
(ii) The mean is one of the numbers in a data.
(iii) The median is always one of the numbers in a data.
(iv) The data 6, 4, 3, 8, 9, 12, 13, 9 has mean 9.
Solution:
(i) True
(ii) False
(iii) True
(iv) False
NCERT Solutions for Class 7 Maths Chapter 3 Data Handling Exercise 3.3
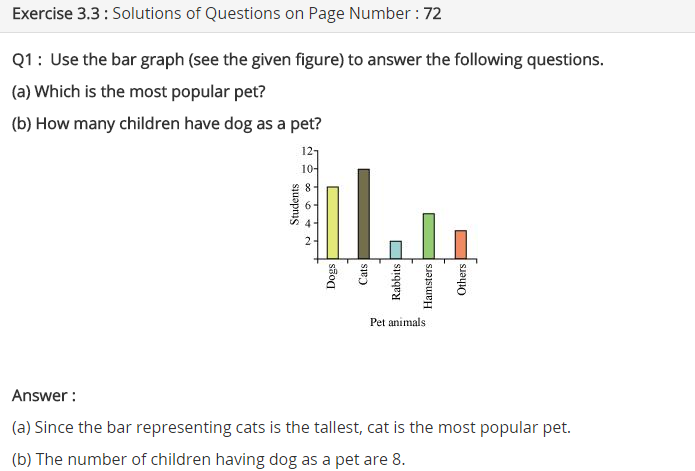
Ex 3.3 Class 7 Maths Question 1.
Use the bar graph to answer the following questions.
(a) Which is the most popular pet?
(b) How many students have dog as a pet?
Solution:
From the given bar graph in figure, we have
(a) Cats are the most popular pet among the students.
(b) 8 students have dog as a pet animal.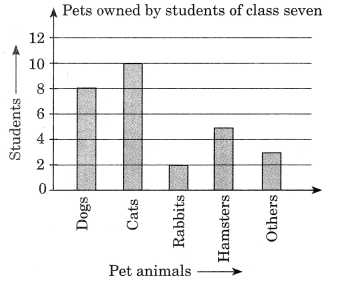
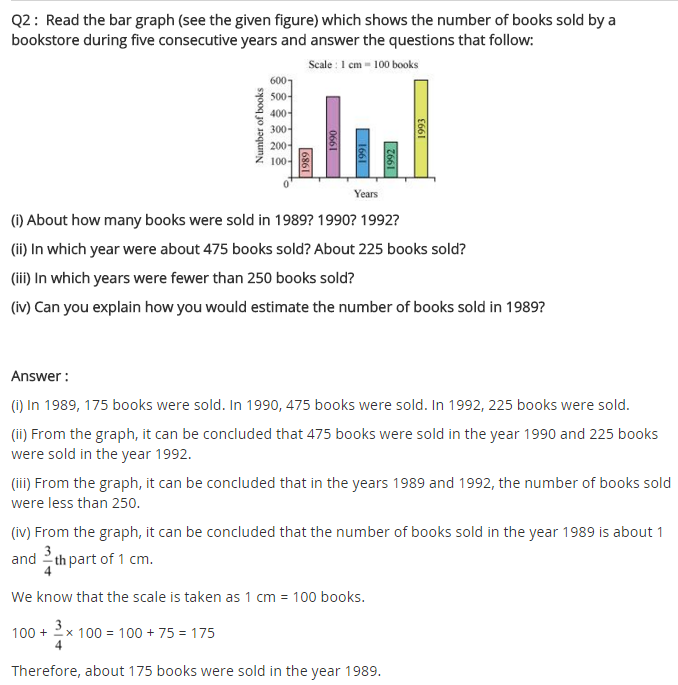
Ex 3.3 Class 7 Maths Question 2.
Read the bar graph which shows the number of books sold by a bookstore during five consecutive years and answer the following questions:
(i) About how many books were sold in 1989, 1990, 1992?
(ii) In which year were about 475 books sold? About 225 books sold?
(iii) In which year were fewer than 250 books sold?
(iv) Can you explain how you would estimate the number of books sold in 1989?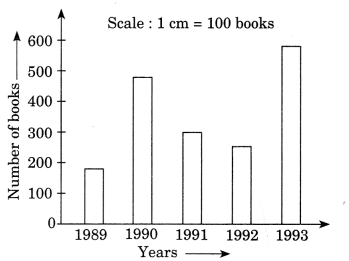
Solution:
From the given bar graph, we have
(i) Number of books sold in the year 1989 is about 180, in 1990 is about 490 and in 1992 is about 295.
(ii) About 475 books were sold in 1990. About 225 books were sold in the year 1992.
(iii) Fewer than 250 books were sold in the years 1989 and 1992.
(iv) On y-axis, the line is divided into 10 small parts of 10 books each. So, we can estimate the number of books sold in 1989 is about 180.
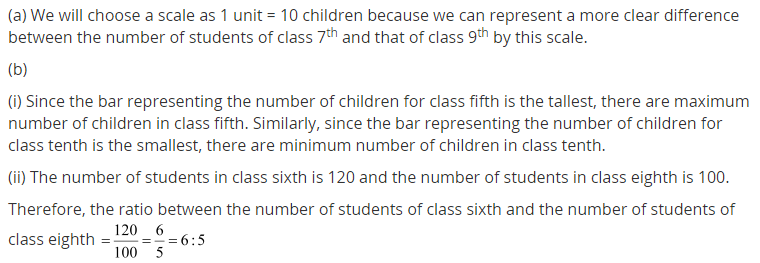
Ex 3.3 Class 7 Maths Question 3.
Number of children in six different classes are given below. Represent the data on a bar graph.
| Class | Number of children |
| Fifth | 135 |
| Sixth | 120 |
| Seventh | 95 |
| Eighth | 100 |
| Ninth | 90 |
| Tenth | 80 |
(a) How would you choose a scale?
(b) Answer the following questions:
- Which class has the maximum number of children? And the minimum?
- Find the ratio of students of class sixth to £he students of class eighth.
Solution: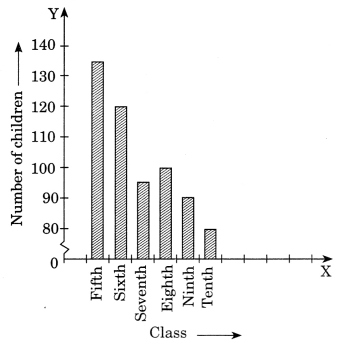
(a) Scale on y-axis is 1 cm = 10 students
(b)
- Fifth class has the maximum number of children i.e., 135.
Tenth class has the minimum number of children i.e., 80. - Number of children in class eight = 100
∴ Ratio of class sixth to the students of class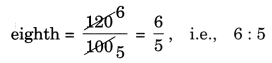
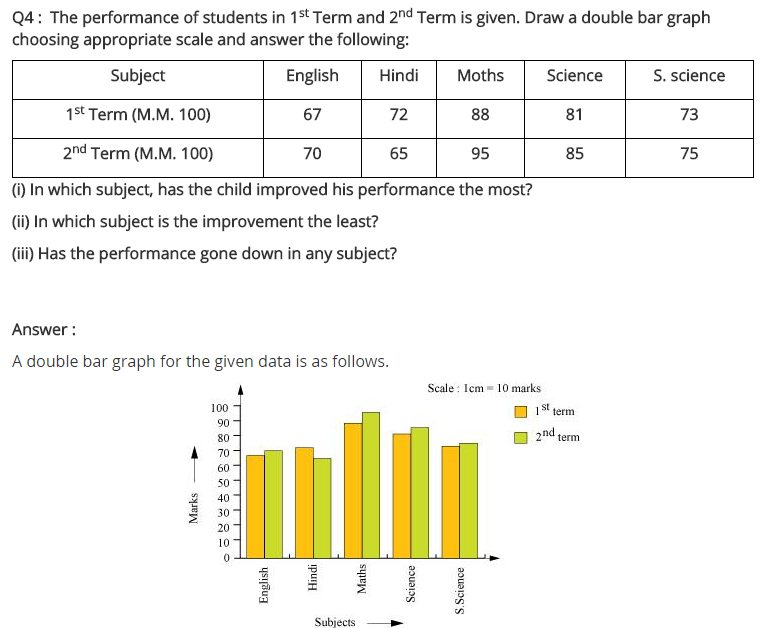
Ex 3.3 Class 7 Maths Question 4.
The performance of a student in 1st term and 2nd term is given. Draw a double bar graph choosing appropriate scale and answer the following:
| Subject | 1st term (M.M. 100) | 2nd term (M.M. 100) |
| English | 67 | 70 |
| Hindi | 72 | 65 |
| Math | 88 | 95 |
| Science | 81 | 85 |
| S. Science | 73 | 75 |
(i) In which subject, has the child improved his performance the most?
(ii) In which subject is the improvement the least?
(iii) Has the performance gone down in any subject?
Solution: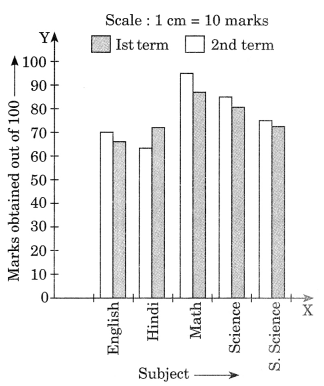
(i) In Math, the performance of the students improved the most.
(ii) In social science, the performance of the students improved the least.
(iii) Yes, in Hindi the performance of the students has gone down.
Ex 3.3 Class 7 Maths Question 5.
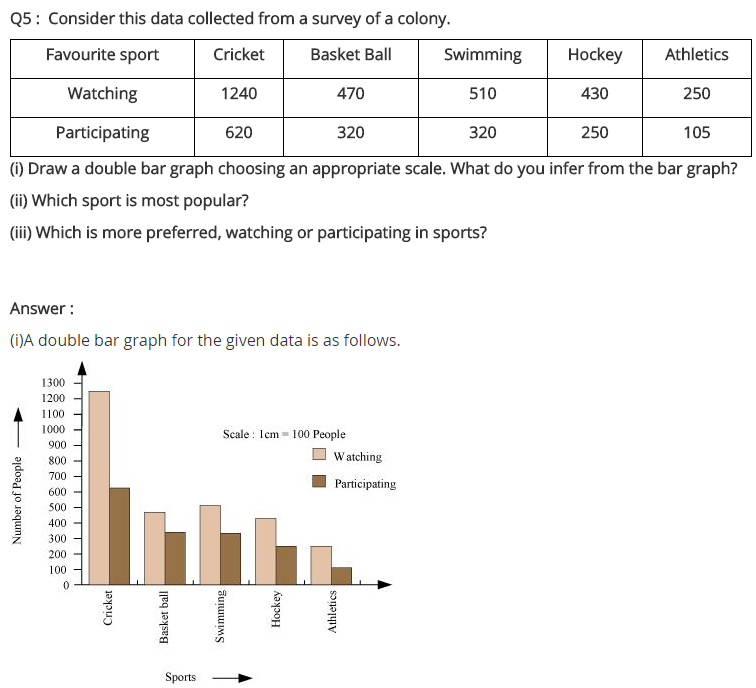
Consider this data collected from survey of a colony.
| Favourite sport | Watching | Participating |
| Cricket | 1240 | 620 |
| Basket ball | 470 | 320 |
| Swimming | 510 | 320 |
| Hockey | 430 | 250 |
| Athletics | 250 | 105 |
(i) Draw a double bar graph choosing an appropriate scale. What do you infer from the bar graph?
(ii) Which sport is most popular?
(iii) Which is more preferred, watching or participating in sports?
Solution:
(i) The above bar graph depicts the number of people who are watching and who are participating in sports.
(ii) Cricket is the most popular sport.
(iii) Watching the sports is more preferred by the people.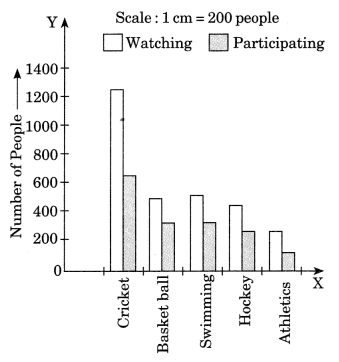
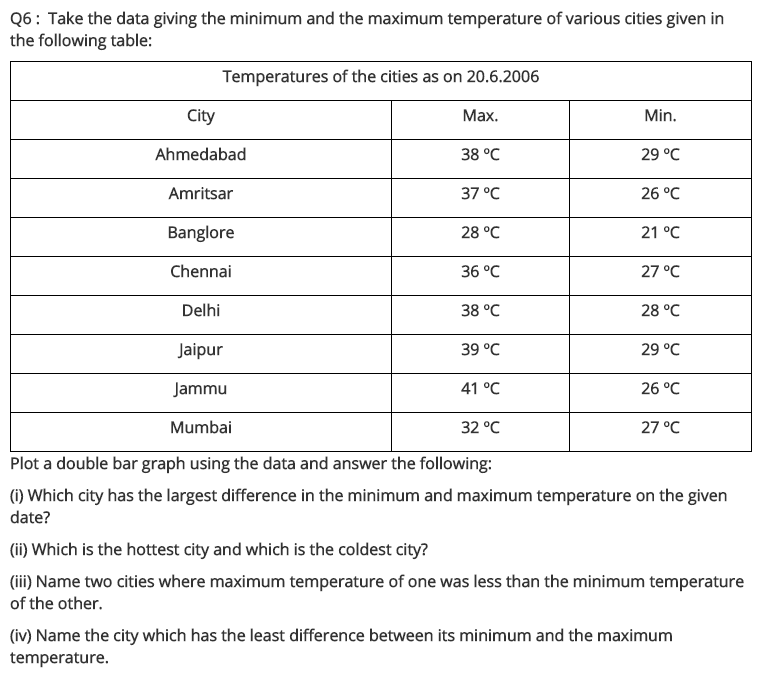
Ex 3.3 Class 7 Maths Question 6.
Take the data giving the minimum and the maximum temperature of various cities given in the beginning of this chapter. Plot a double bar graph using the data and answer the following:
(i) Which city has the largest difference in the minimum and maximum temperature on the given date?
(ii) Which is the hottest city and which is the coldest city?
(iii) Name two cities where maximum temperature of one was less than the minimum temperature of the other.
(iv) Name the city which has the least difference between its minimum and maximum temperature.
| Temperature of cities as on 20.6.2006 | ||
| City | Max. | Min. |
| Ahmedabad | 38°C | 29°C |
| Amritsar | 37°C | 26°C |
| Bengaluru | 28°C | 21°C |
| Chennai | 36°C | 27°C |
| Delhi | 38°C | 28°C |
| Jaipur | 39°C | 29°C |
| Jammu | 41°C | 26°C |
| Mumbai | 32°C | 27°C |
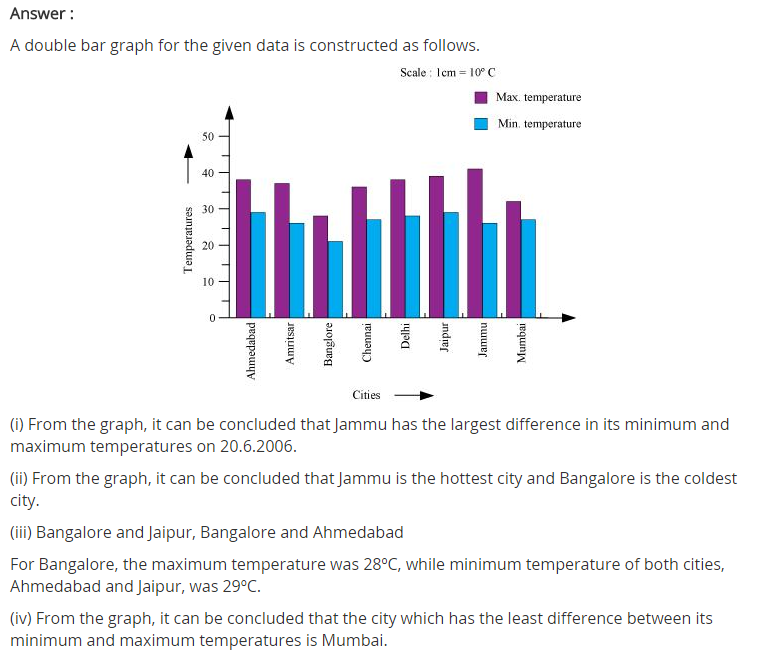
Solution:
Double bar graph: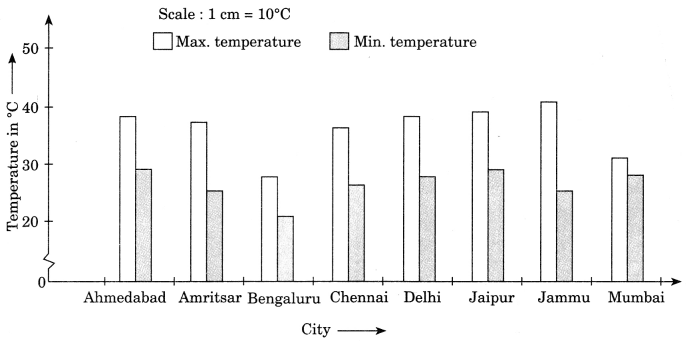
(i) Jammu has the largest difference between the maximum and minimum temperature i.e. 41°C – 26°C = 15°C
(ii) Hottest city is Jammu with 41°C temperature and coldest city is Bengaluru with 21°C temperature.
(iii)
- Bengaluru having its maximum temperature 28°C is less than the minimum temperature 29°C in Ahmedabad.
- Bengaluru having its maximum tem-perature 28°C is less than the maximum temperature 29°C in Jaipur.
(iv) Mumbai has the least difference between its minimum and maximum temperatures i.e. 32°C – 27°C = 5°C
NCERT Solutions for Class 7 Maths Chapter 3 Data Handling Exercise 3.4
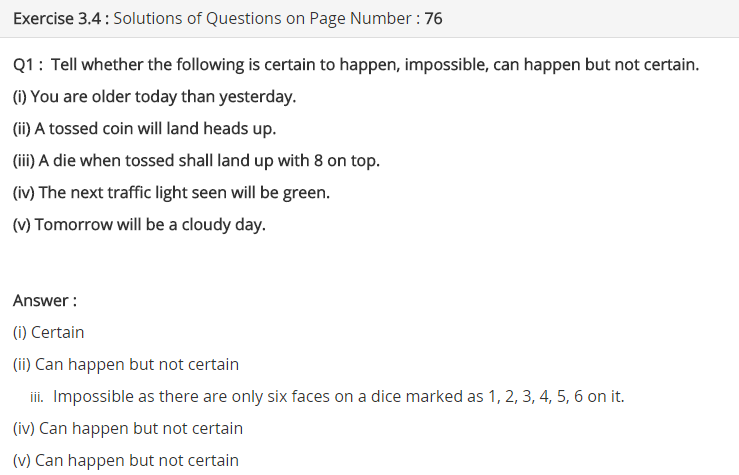
Ex 3.4 Class 7 Maths Question 1.
Tell whether the following situations are certain to happen, impossible to happen, can happen but not certain.
(i) You are older today than yesterday.
(ii) A tossed coin will land heads up.
(iii) A dice when tossed shall land up with 8 on top.
(iv) The next traffic light seen will be green.
(v) Tomorrow will be a cloudy day.
Solution:
| Event | Chance |
| (i) You are older today than yesterday. | Certain to happen. |
| (ii) A tossed coin will land heads up. | Can happen but not certain. |
| (iii) A dice when tossed shall land up 8 on the top. | Impossible. |
| (iv) The next traffic light seem will be green. | Can happen but not certain. |
| (v) Tomorrow will be cloudy day. | Can happen but not certain. |
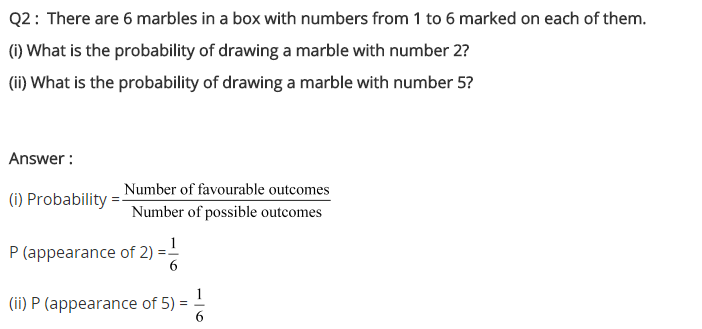
Ex 3.4 Class 7 Maths Question 2.
There are 6 marbles in a box with numbers from 1 to 6 marked on each of them.
(i) What is the probability of drawing a marble with number 2?
(ii) What is the probability of drawing a marble with number 5?
Solution:
(i) Total number of marbles marked with the number from 1 to 6 = 6
∴ n(S) = 6
Number of marble marked with 2=1
∴ n(E) = 1
∴ Required probability =
(ii) Number of marble marked with 5 = 1
∴ n(E) = 1
∴ Required probability =
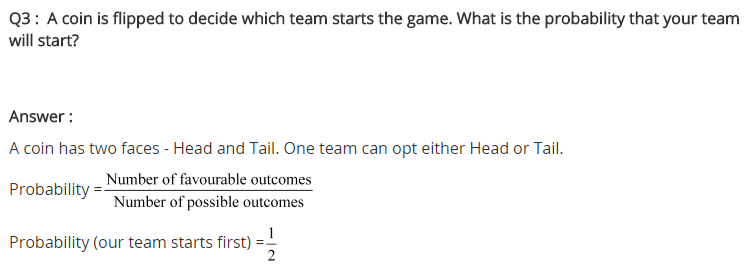
Ex 3.4 Class 7 Maths Question 3.
A coin is flipped to decide which team starts the game. What is the probability that your team will start?
Solution:
Coin has 2 faces—Head (H) and Tail (T)
∴ Sample space S(n) = 2
Number of successful event n(E) = 1
∴ Required probability =
| Sample Space: The sample space of an experiment is the number of all possible outcomes of that experiment. |
Data Handling Class 7 Extra Questions Very Short Answer Type
Question 1.
Find the range of the following data:
21, 16, 30, 15, 16, 18, 10, 24, 26, 20
Solution:
Greatest number 30
Smallest number = 10
Range = 30 – 10 = 20
Question 2.
Find the mode of the following data:
24, 26, 23, 26, 22, 25, 26, 28
Solution:
Arranging the given data with the same value together, we get
22, 23, 24, 25, 26, 26, 26, 28
Here, 26 occurs the greatest number of times i.e. 3 times
Thus, the required mode = 26.
Question 3.
Find the average of the numbers 8, 13, 15.
Solution:

Question 4.
Find the median of the following data:
8, 6, 10, 12, 14
Solution:
Let us arrange the given data in increasing order,
6, 8, 10, 12, 14
n = 5 (odd)
Median = (
Thus, the required median = 10.
Question 5.
Find the median of the following data:
20, 14, 6, 25, 18, 13, 19, 10, 9, 12
Solution:
Arranging the given data in increasing order, we get
6, 9, 10, 12, 13, 14, 18, 19, 20, 25
n = 10 (even)
Thus, the required median = 13.5
Question 6.
A fair die is rolled, find the probability of getting a prime number.
Solution:
Number on a die = 1, 2, 3, 4, 5, 6
n(S) = 6
Prime numbers = 2, 3, 5
n(E) = 3
Probability =
Thus the required probability =
Question 7.
If the averages of the given data 6, 10, 12, x, 16 is 14, find the value of x.
Solution:
Average of the given numbers
Thus, the required value of x is 26.
Question 8.
Find the mean of the first 5 multiples of 3.
Solution:
Five multiples of 3 are 3, 6, 9, 12 and 15![]()
Hence, the required mean = 9.
Data Handling Class 7 Extra Questions Short Answer Type
Question 9.
The following bar graph shows the number of books sold by a publisher during the five consecutive years. Read the bar graph and answer the following questions:
(i) About how many books were sold in 2008, 2009 and 2012 years?
(ii) In which years were 575 books were sold?
(iii) In which years were the minimum number of books sold?
Solution:
(ii) In the year of 2012, maximum number of books i.e. 575 were sold.
(iii) Minimum number of books i.e. 150 were sold in the year 2008.
Question 10.
Find the mean and median of first five prime numbers.
Solution:
First five prime numbers are: 2, 3, 5, 7 and 11
Here, n = 5
Median is the middle term, i.e., 5.
Question 11.
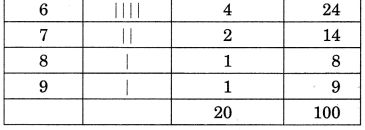
The marks obtained (out of 10) by 80 students in a class test are given below:
Find the mode of the above data.
Solution:
In the given frequency distribution table, we find that the observation 7 has maximum frequency, i.e., 20
Hence, the required mode = 7.
Question 12.
A bag contains 5 white and 9 red balls. One ball is drawn at random from the bag. Find the probability of getting
(a) a white ball
(b) a red ball
Solution:
Total number of balls = 5 + 9 = 14 balls
n(S) = 14
(i) Number of white ball = 5
n(E) = 5
Probability of getting white ball =
(ii) Number of red balls = 9
n(E) = 9
Probability of getting white ball =
Question 13.
A dice is tossed once. Find the probability of getting
(i) a number 5
(ii) a number greater than 5
(iii) a number less than 5
(iv) an odd number
(v) an even number
(vi) a number greater than 6
Solution:
Total number of outcomes = 6
n(S) = 6
(i) An event of getting a number 5
n(E) = 1
Probability =
(ii) An event of getting a number 5 greater than 5, i.e., 6
n(E) = 1
Probability =
(iii) An event of getting a number less than 5, i.e., 1, 2, 3 and 4.
n(E) = 4
Probability =
(iv) An event of getting an odd number, i.e., 1, 3 and 5.
n(E) = 3
Probability =
(v) An event of getting an even number, i.e., 2, 4 and 6.
n(E) = 3
Probability =
(vi) An event of getting a number greater than 6, i.e., Nil.
n(E) = 0
Probability =
Data Handling Class 7 Extra Questions Long Answer Type
Question 14.
The data given below shows the production of motorbikes in a factory for some months of two consecutive years.
Study the table given above and the answer the following questions:
(a) Draw a double bar graph using an appropriate scale to depict the above information and compare them.
(b) In which year was the total output maximum?
(c) Find the mean production for the year 2007.
(d) For which month was the difference between the production for the two years is the maximum?
(e) In which month for the year 2008, the production was the maximum?
(f) In which month for the year 2007, the production was the least? [NCERT Exemplar]
Solution:
(a) Double bar graph
Scale : 1 cm = 100 Motor Bikes
The above bar graph depicts the total production of motorbikes in two consecutive years.
Total production in 2007 was 22100 whereas in 2008 it was 21100.
(b) In the year 2007, the total production was maximum (22100)
(c) Mean production in the year 2007 is
(d) Production of motorbikes in the May 2007 = 4500 and in May 2008 = 3200
Difference = 4500 – 3200 = 1300 which is the maximum
(e) In the month of August 2008, production was maximum i.e., 6000
(f) In the month of Feb. 2007 the production was least i.e., 2800.
Question 15.
A coin and a die are tossed once together. Find the total number of outcomes.
Solution:
A coin has two faces, Head (H) and Tail (T)
A die has six faces marked with numbers 1, 2, 3, 4, 5, 6
Possible outcomes are:
H1, H2, H3, H4, H5, H6, T1, T2, T3, T4, T5, T6
Total number of outcomes = 2 × 6 = 12
.png)