.png)
Class 8 Maths Chapter 5 Data Handling All Exercise NCERT Solutions
- Class 8 Maths Data Handling Exercise 5.1
- Class 8 Maths Data Handling Exercise 5.2
- Class 8 Maths Data Handling Exercise 5.3
NCERT Solutions for Class 8 Maths Chapter 5 Data Handling Exercise 5.1
Ex 5.1 Class 8 Maths Question 1.
For which of these would you use a histogram to show the data?
(i) The number of letters for different areas in a postman’s bag.
(ii) The height of competitors in an athletics meet.
(iii) The number of cassettes produced by 5 companies.
(iv) The number of passengers boarding trains from 7 a.m to 7 p.m at a station.
Give a reason for each.
Solution:
(i) The number of areas cannot be represented in class-intervals. So, we cannot use the histogram to show the data.
(ii) Height of competitors can be divided into intervals. So, we can use histogram here.
For example: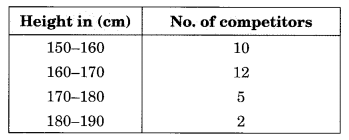
(iii) Companies cannot be divided into intervals. So, we cannot use histogram here.
(iv) Time for boarding the train can be divided into intervals. So, we can use histogram here.
For example: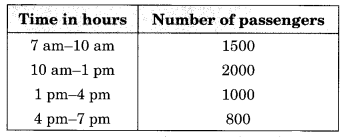
Ex 5.1 Class 8 Maths Question 2.
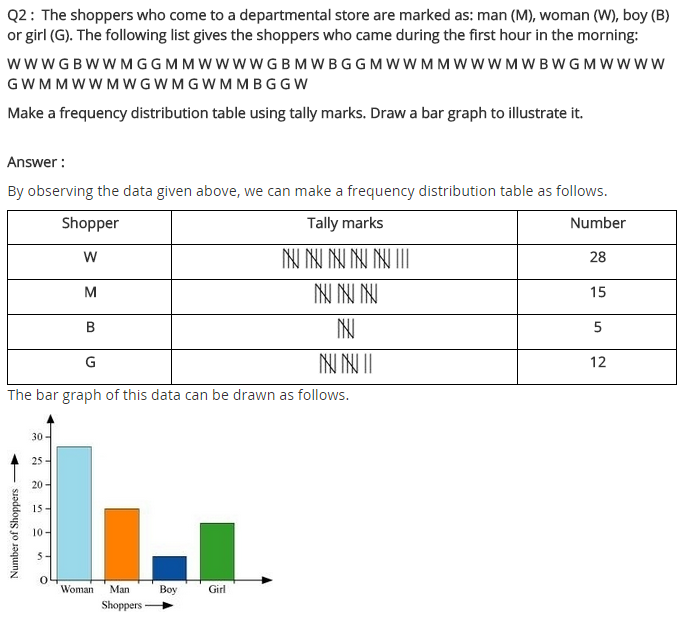
The shoppers who come to a departmental store are marked as: man (M), woman (W), boy (B) or girl (G). The following list gives the shoppers who came during the first hour in the morning.
W W W G B W W M G G M M W W W W
G B M W B G G M W W M M W W W
M W B W G M W W W W G W M M W
W M W G W M G W M M B G G W
Make a frequency distribution table using tally marks. Draw a bar graph to illustrate it.
Solution: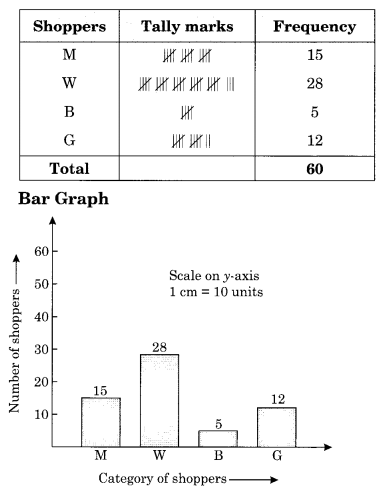
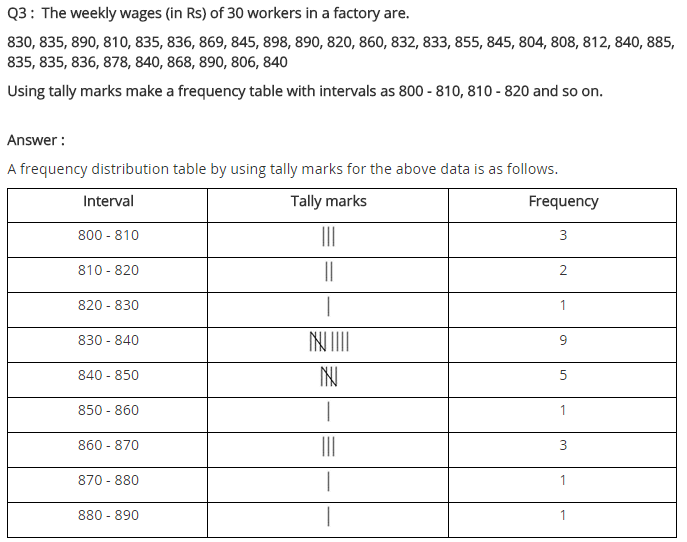
Ex 5.1 Class 8 Maths Question 3.
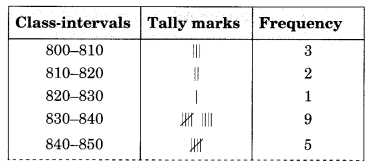
The weekly wages (in ₹) of 30 workers in a factory are:
830, 835, 890, 810, 835, 836, 869, 845, 898, 890,
820, 860, 832, 833, 855, 845, 804, 808, 812, 840,
885, 835, 835, 836, 878, 840, 868, 890, 806, 840
Using tally marks make a frequency table with intervals as 800-810, 810-820 and so on.
Solution: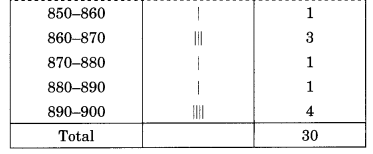
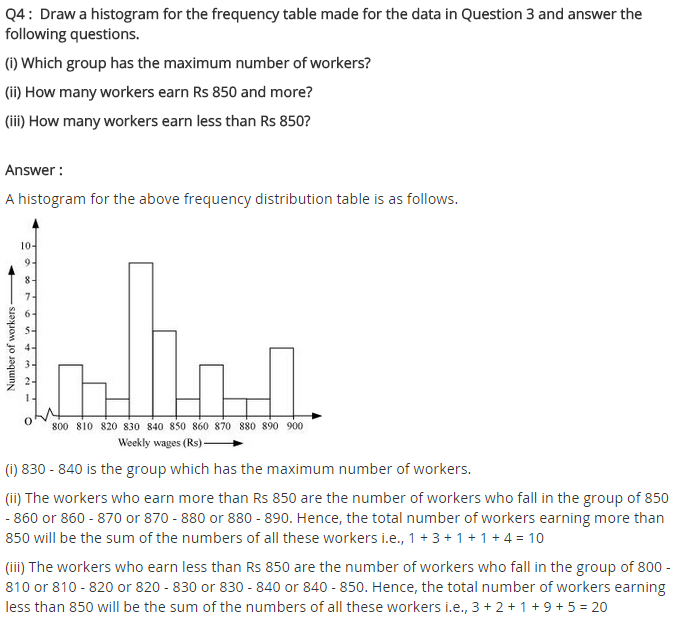
Ex 5.1 Class 8 Maths Question 4.
Draw a histogram for the frequency table made for the data in Question 3, and answer the following questions:
(i) Which group has the maximum number of workers?
(ii) How many workers earn ₹ 850 and more?
(iii) How many workers earn less than ₹ 850?
Solution:
Refer to the frequency table of Question No. 3.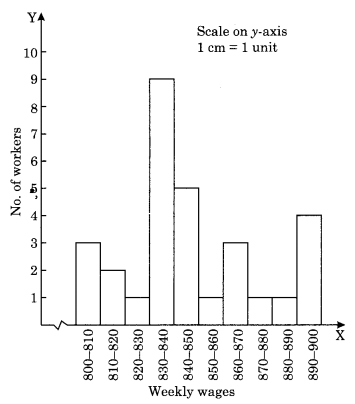
(i) Group 830-840 has the maximum number of workers, i.e., 9.
(ii) 10 workers earn equal and more than ₹ 850.
(iii) 20 workers earn less than ₹ 850.
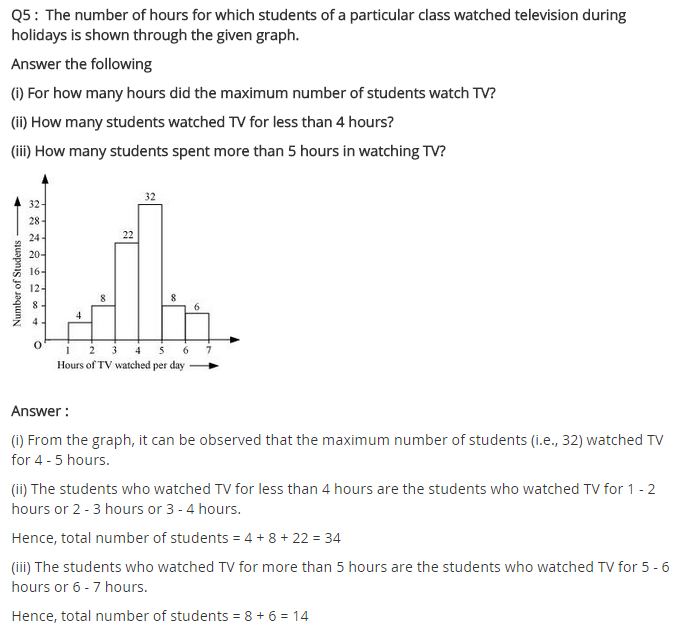
Ex 5.1 Class 8 Maths Question 5.
The number of hours for which students of a particular class watched television during holidays is shown through the given graph.
Answer the following questions.
(i) For how many hours did the maximum number of students watch TV?
(ii) How many students watched TV for less than 4 hours?
(iii) How many students spent more than 5 hours watching TV?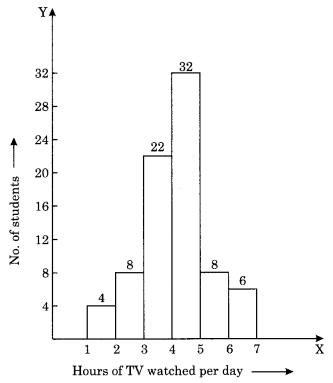
Solution:
(i) 32 is the maximum number of students who watched TV for 4 to 5 hours.
(ii) 4 + 8 + 22 = 34 students watched TV for less than 4 hours.
(iii) 8 + 6 = 14 students watched TV for more than 5 hours.
NCERT Solutions for Class 8 Maths Chapter 5 Data Handling Exercise 5.2
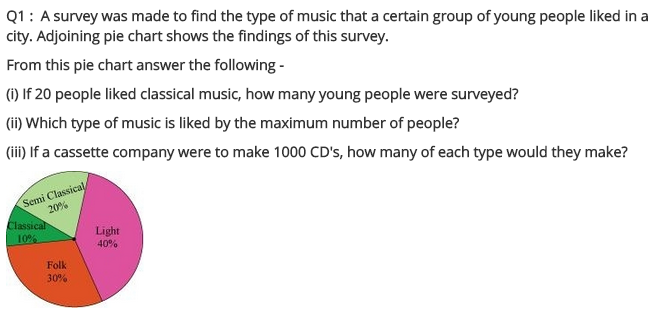
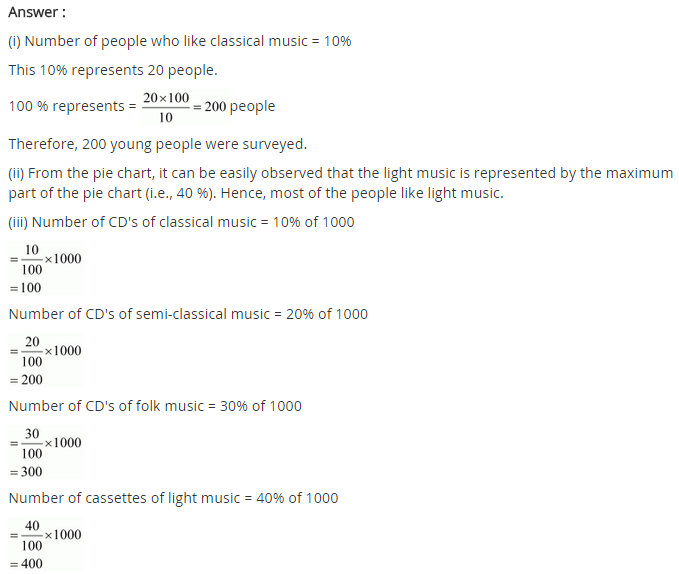
Ex 5.2 Class 8 Maths Question 1.
A survey was made to find the type of music that a certain group of young people liked in a city. The adjoining pie chart shows the findings of this survey.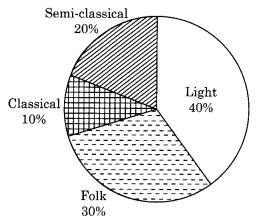
From this pie chart answer the following:
(i) If 20 people liked classical music, how many young people were surveyed?
(ii) Which type of music is liked by the maximum number of people?
(iii) If a cassette company were to make 1000 CDs. How many of each type would they make?
Solution:
(i) Number of young people who were surveyed =
(ii) Light music is liked by the maximum people, i.e., 40%
(iii) Total number of CD = 1000
Number of viewers who like classical music =
Number of viewer who like semi-classical music =
Number of viewers who like light music =
Number of viewers who like folk music =
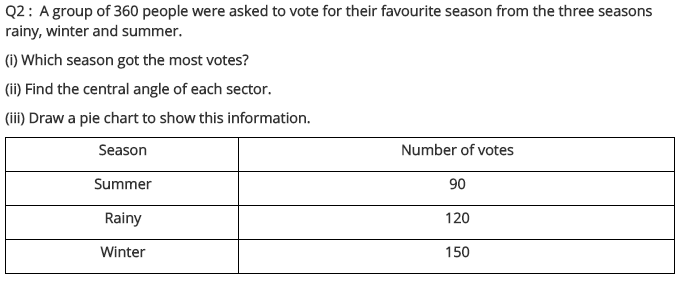
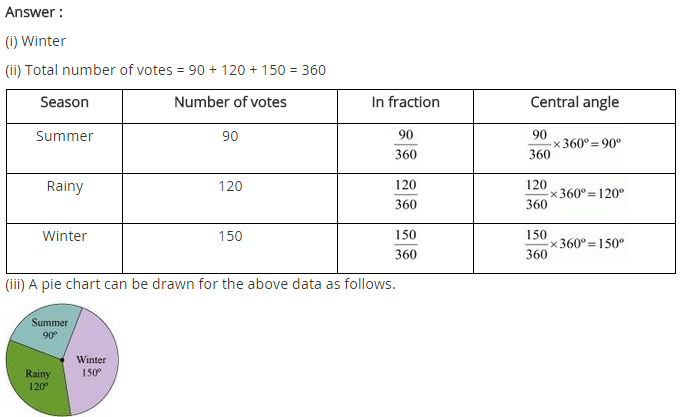
Ex 5.2 Class 8 Maths Question 2.
A group of 360 people were asked to vote for their favourite season from the three seasons rainy, winter and summer.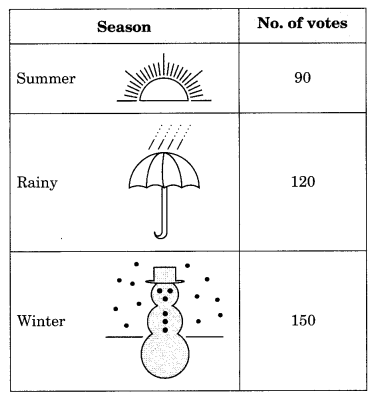
(i) Which season got the most votes?
(ii) Find the central angle of each sector.
(iii) Draw a pie chart to show this information.
Solution:
(i) Winter season got the most votes, i.e. 150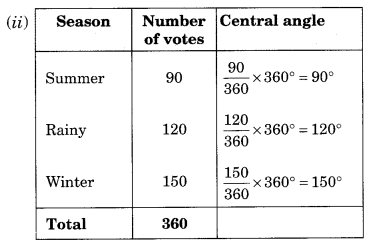
(iii) Pie chart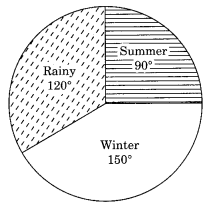
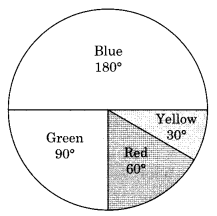
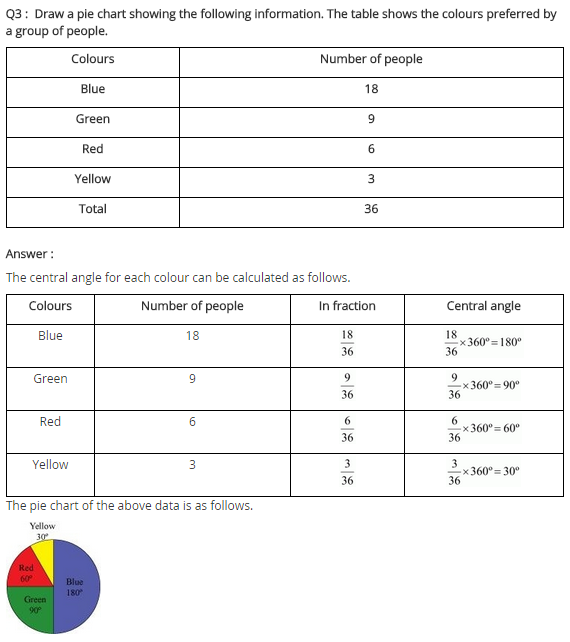
Ex 5.2 Class 8 Maths Question 3.
Draw a pie chart showing the following information. The table shows the colours preferred by a group of people.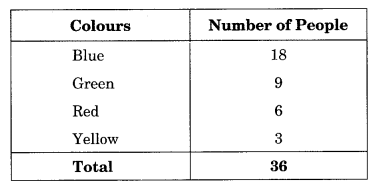
Solution:
Table to find the central angle of each sector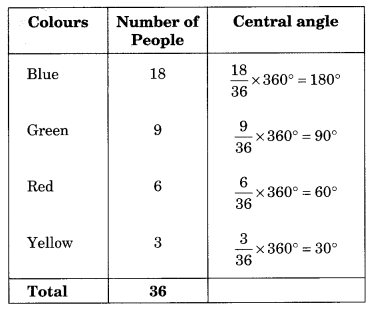
Ex 5.2 Class 8 Maths Question 4.
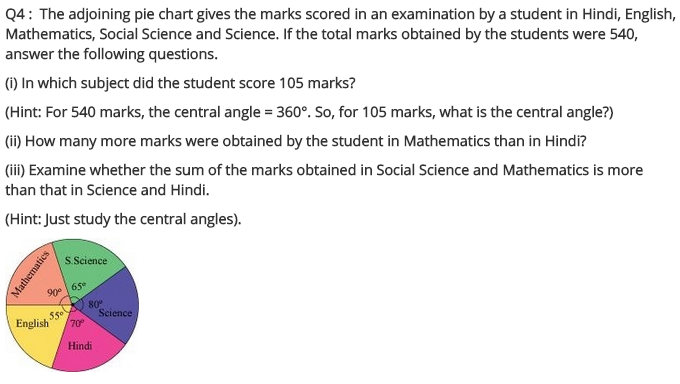
The following pie chart gives the marks scored in an examination by a student in Hindi, English, Mathematics, Social Science and Science. If the total marks obtained by the students were 540, answer the following questions.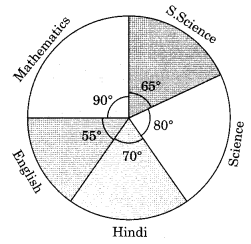
(i) In which subject did the student score 105 marks?
(Hint: for 540 marks, the central angle = 360°. So, for 105 marks, what is the central angle?)
(ii) How many more marks were obtained by the student in Mathematics than in Hindi?
(iii) Examine whether the sum of the marks obtained in Social Science and Mathematics is more than that in Science and Hindi.
(Hint: Just study the central angles).
Solution: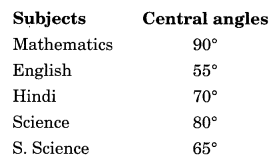
(i) For 540 marks, the central angle = 360°
For 105 marks the central angle =
Corresponding subject = Hindi
(ii) Marks obtained in Mathematics =
Marks obtained in Mathematics more than Hindi = 135 – 105 = 30
(iii) Central angle of Social Science + Mathematics = 65° + 90° = 155°
Central angle of Science + Hindi = 80° + 70° = 150°
Ex 5.2 Class 8 Maths Question 5.
Marks obtained in Social Science and Mathematics are more than that of the marks obtained in Science and Hindi.
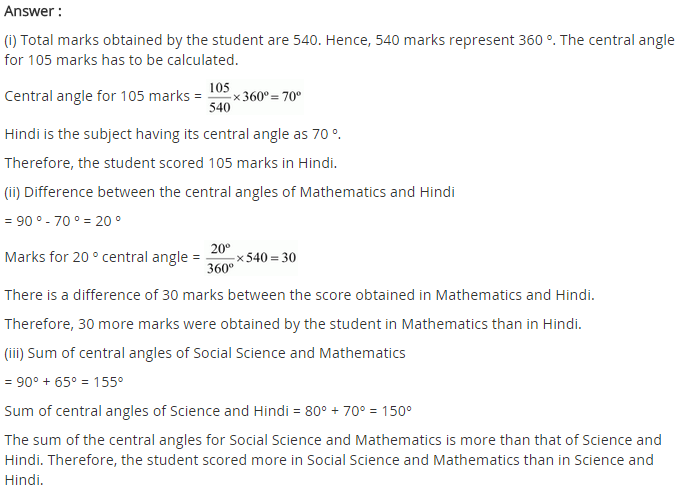
The number of students in a hostel, speaking different languages is given below. Display the data in a pie chart.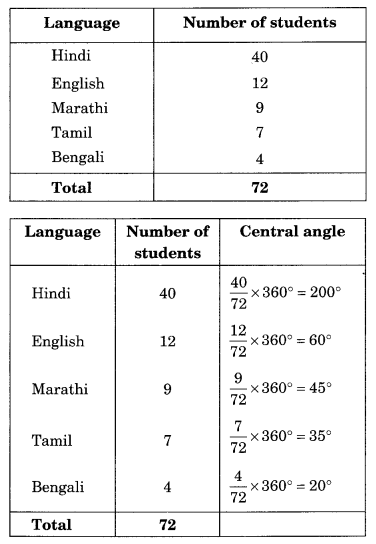
Solution: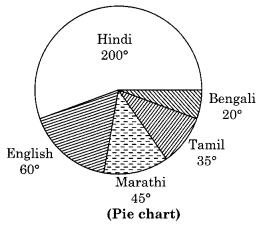
NCERT Solutions for Class 8 Maths Chapter 5 Data Handling Exercise 5.3
Ex 5.3 Class 8 Maths Question 1.
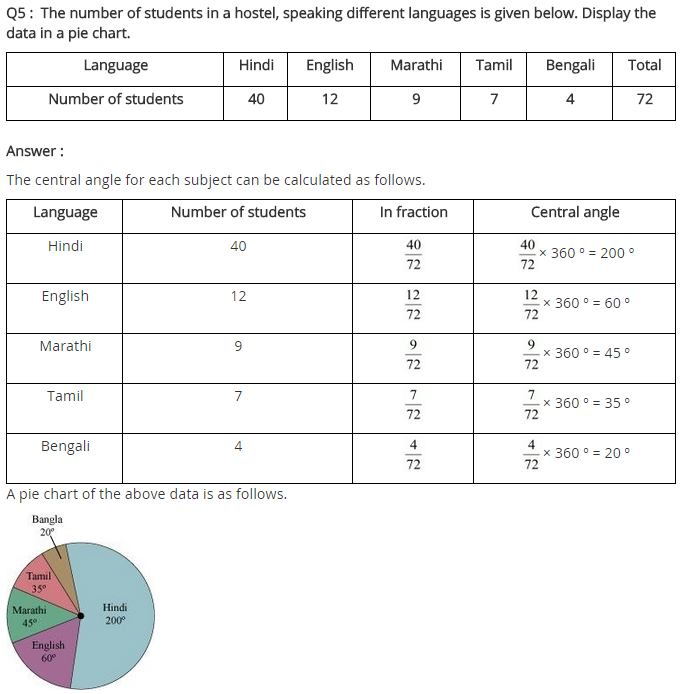
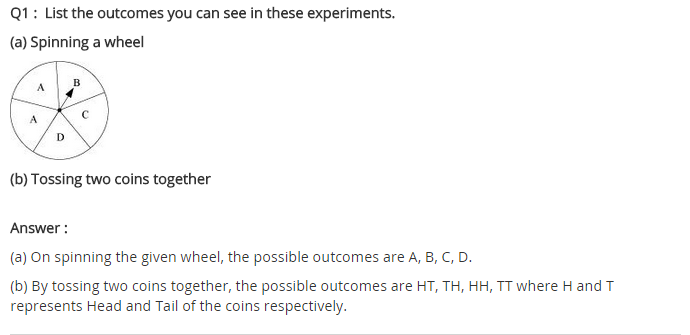
List the outcomes you can see in these experiments.
(i) Spinning a wheel
(ii) Tossing two coins together
Solution:
(i) On spinning the wheel, we can get the following outcomes B, C, D, E and A.
(ii) When two coins are tossed together, we get the following outcomes
HH, HT, TH, TT (Where H denotes Head and T denotes Tail)
Ex 5.3 Class 8 Maths Question 2.
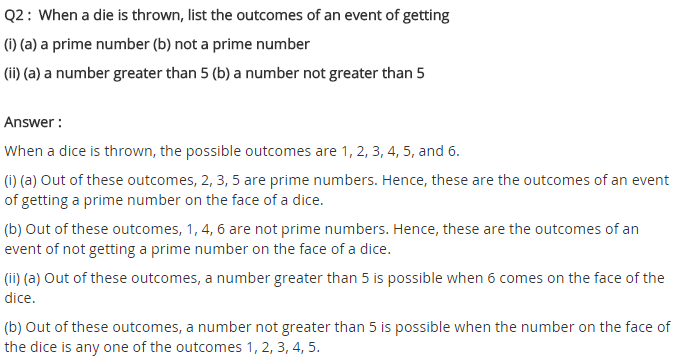
When a die is thrown, list the outcomes of an event of getting
(i) (a) a prime number
(b) not a prime number
(ii) (a) a number greater than 5
(b) a number not greater than 5
Solution:
(i) (a) The prime number are 2, 3 and 5
Required outcomes = 2, 3 and 5
(b) Outcomes for not a prime number are 1, 4 and 6
Required outcomes = 1, 4, 6.
(ii) (a) Outcomes for a number greater than 5 = 6
Required outcome = 6
(b) Outcomes for a number not greater than 5 are 1, 2, 3, 4, 5
Required outcomes = 1, 2, 3, 4, 5.
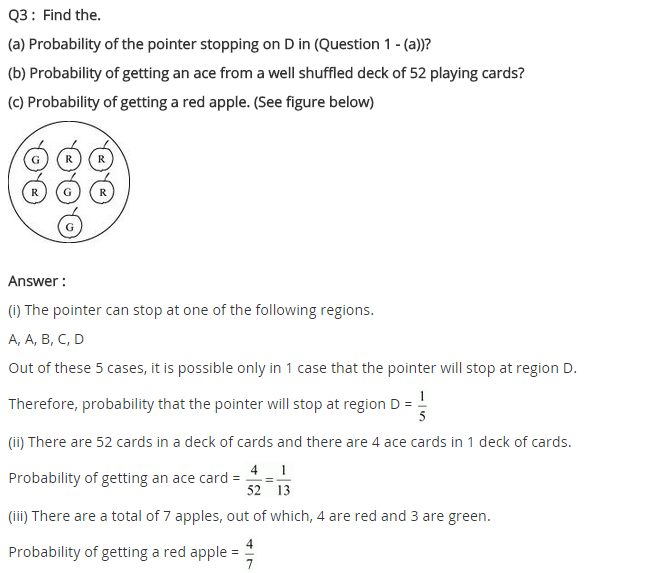
Ex 5.3 Class 8 Maths Question 3.
Find the
(i) Probability of the pointer stopping on D in (Question 1-(a))?
(ii) Probability of getting an ace from a well-shuffled deck of 52 playing cards?
(iii) Probability of getting a red apple, (see figure below)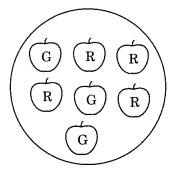
Solution:
(i) Refer to fig. Question 1-(a)
Total number of sectors = 5
Number of sector where the pointer stops = 1, i.e. D
Probability of pointer stopping at D =
(ii) Number of aces = 4 (one from each suit i.e. heart, diamond, club and spade)
Total number of playing cards = 52
Probability of getting an ace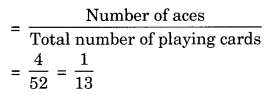
(iii) Total number of apples = 7
Number of red apples = 4
Probability of getting red apples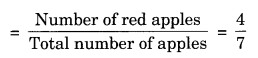
Ex 5.3 Class 8 Maths Question 4.
Numbers 1 to 10 are written on ten separate slips (one number on one slip), kept in a box and mixed well. One slip is choosen from the box without looking into it. What is the probability of:
(i) getting a number 6?
(ii) getting a number less than 6?
(iii) getting a number greater than 6?
(iv) getting a 1-digit number?
Solution:
(i) Probability of getting a number 6 =
(ii) Probability of getting a number less than 6 =
(iii) Probability of getting a number greater than 6 =
(iv) Probability of getting a 1-digit number =
[∵ 1-digit numbers are 9, i.e. 1, 2, 3, 4, 5, 6, 7, 8, 9]
Ex 5.3 Class 8 Maths Question 5.
If you have a spinning wheel with 3 green sectors, 1 blue sector and 1 red sector, what is the probability of getting a green sector? What is the probability of getting a non-blue sector?
Solution:
Total number of sectors are = 3 green + 1 blue + 1 red = 5 sectors
Probability of getting a green sector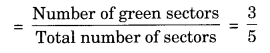
Number of non-blue sectors are = 3 green + 1 red = 4 sectors
Probability of getting non-blue sector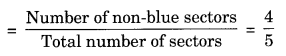
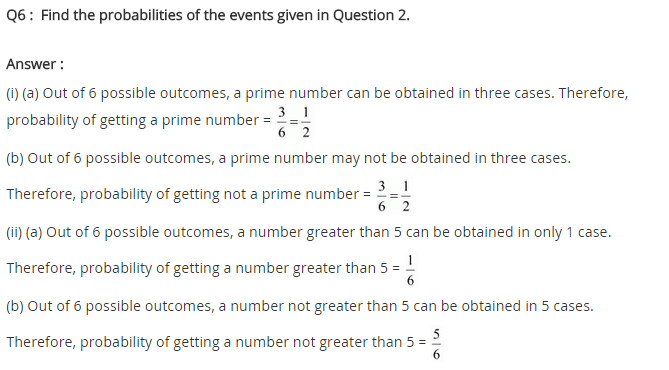
Ex 5.3 Class 8 Maths Question 6.
Find the probabilities of the events given in Question 2.
Solution:
Refer to Question 2, we have
(i) (a) Probability of getting a prime number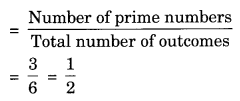
(b) Probability of getting a non-prime number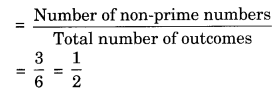
(ii) (a) Probability of getting a number greater than 5 =
(b) Probability of a number not greater than 5 =
- Chapter 1 Rational Numbers
- Chapter 2 Linear Equations in One Variable
- Chapter 3 Understanding Quadrilaterals
- Chapter 4 Practical Geometry
- Chapter 5 Data Handling
- Chapter 6 Squares and Square Roots
- Chapter 7 Cubes and Cube Roots
- Chapter 8 Comparing Quantities
- Chapter 9 Algebraic Expressions and Identities
- Chapter 10 Visualising Solid Shapes
- Chapter 11 Mensuration
- Chapter 12 Exponents and Powers
- Chapter 13 Direct and Indirect proportions
- Chapter 14 Factorisation
- Chapter 15 Introduction to Graphs
- Chapter 16 Playing with Numbers
.png)